Systematic Review
Flow Charts

Free, interactive flow charts for your systematic review

Find Out More

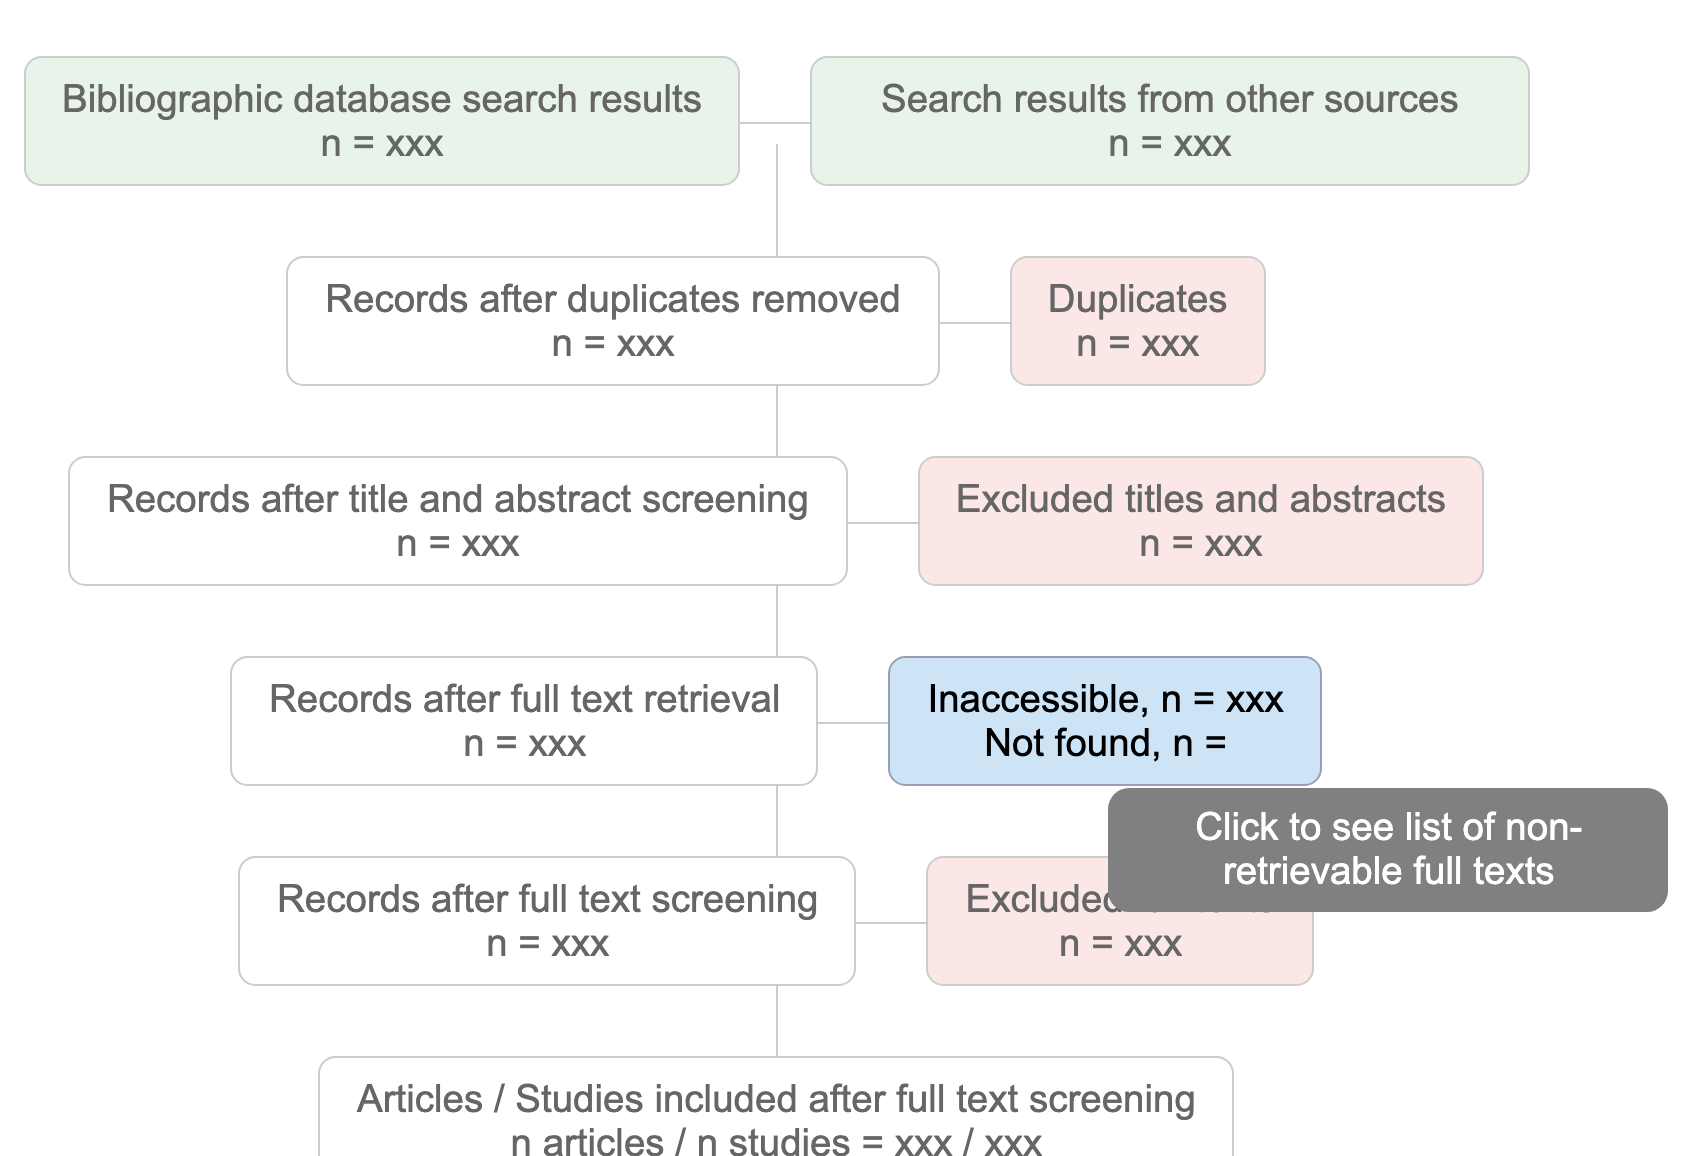
Interactive flow charts for communcating review methods


Interactivity allows the charts to be embedded in a website, linking the reader instantly with more information on the methods used and the results found. Static versions can be used for documents.

The flow charts have been designed to be clear and concise ways to communicate a review or map's methods, whilst providing links to more detailed information.

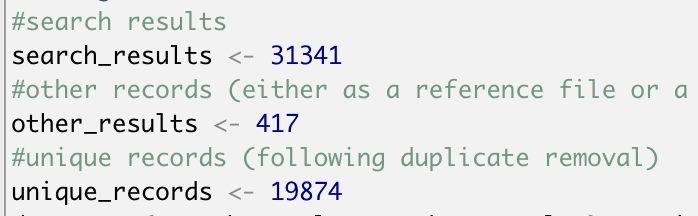
Versions are provided in several formats: 1) either combining title and abstract screening together, or separately as title then abstract level assessments; 2) for systematic mapping or systematic review, depending on which method is used; 3) in live, editable HTML format for web-based editing, or in .Rhtml format for those comfortable with basic coding in R.

See the flow charts

The flow charts

Choose your format


Systematic Map Flow Charts

HTML, CSS and javascript versions (no coding knowledge necessary)

Choose either titles and abstracts screened together or separately

Title and abstract separate
Title and abstract combined


Systematic map .Rhtml version - for people comfortable with R (basic knowledge only)

Instructions for use:
  • Select the right file (save the target file that opens in a new window, but remove the added .txt file extension):
  • Open the file in R studio

  • Either enter the relevant numbers manually, or load in a .csv file containing the data as columns

  • Provide hyperlinks (`href`) for each box

  • Click the 'knit' button

  • The output will be saved as an HTML file

  • Embed the html in an <iframe> on your own website

Systematic Review Flow Charts

HTML, CSS and javascript versions (no coding knowledge necessary)

Choose either titles and abstracts screened together or separately

Title and abstract separate
Coming soon...
Title and abstract combined
Coming soon...


Systematic review .Rhtml version - for people comfortable with R (basic knowledge only)

Instructions for use:
  • Select the right file (save the target file that opens in a new window, but remove the added .txt file extension):
  • Open the file in R studio

  • Either enter the relevant numbers manually, or load in a .csv file containing the data as columns

  • Provide hyperlinks (`href`) for each box

  • Click the 'knit' button

  • The output will be saved as an HTML file

  • Embed the html in an <iframe> on your own website

Like this project?


It's been put together by me, Neal Haddaway


Email me about it! Visit the GitHub repo!


This is an Open Source project, with all files provided under a CC BY 4.0 Creative Commons license.

This means that you are free to share and adapt the files,
but you must give appropriate credit, provide a link to the license, and indicate if changes were made.


Please cite as:

Haddaway, NR. 2020. SRflowdiagram: flow charts for systematic reviews and maps. doi: 10.5281/zenodo.4134795.